
Pluralsight Investor Presentation
The Pluralsight Brand Book is presented as an interactive online document, offering a comprehensive guide to the brand guidelines within the education sector.
1 Investor Presentation
2 Safe Harbor Statement
3 1. Calculated by taking the number of global technical team members based on a study by Evans Data Corporation (2018) multiplied by our average billings per user as of December 31, 2019. $31B of TAM for Pluralsight Skills, $11B of TAM for Pluralsight Flow. 2. As of June 30, 2020 $400M TTM BILLINGS (2) Cloud - based technology skills platform closing the global technology skills gap 88% OF TTM BILLINGS (2) FROM BUSINESS CUSTOMERS ~1.43M BUSINESS USERS (2) Helping enterprises adapt and thrive in the digital age Enabling technologists to keep pace with change Addressing $42 billion market opportunity (1) Pluralsight Overview

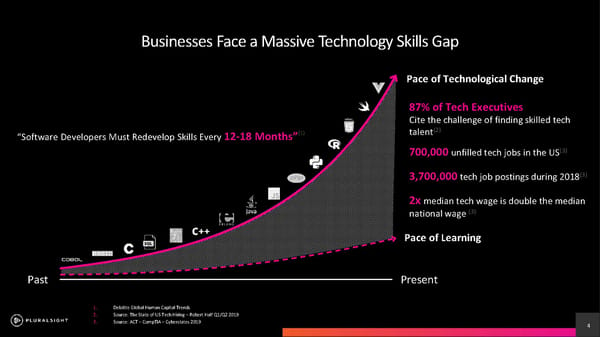
4 1. Deloitte Global Human Capital Trends 2. Source: The State of US Tech Hiring Robert Half Q1/Q2 2019 3. Source: ACT CompTIA Cyberstates 2019 Past Present Pace of Technological Change Pace of Learning 87% of Tech Executives Cite the challenge of finding skilled tech talent (2) 700,000 unfilled tech jobs in the US (3) 3,700,000 tech job postings during 2018 (3) 2x median tech wage is double the median national wage (3) Businesses Face a Massive Technology Skills Gap Software Developers Must Redevelop Skills Every 12 - 18 Months (1)
5 Existing Solutions Fall Short on Delivering for Todays Tech Professional CLASSROOM FREE Online Training Unreliable content with no measurement of mastery Not scalable, personalized or measurable Static corporate mandated courses; mostly broad content focus rather than laser focus on tech skills

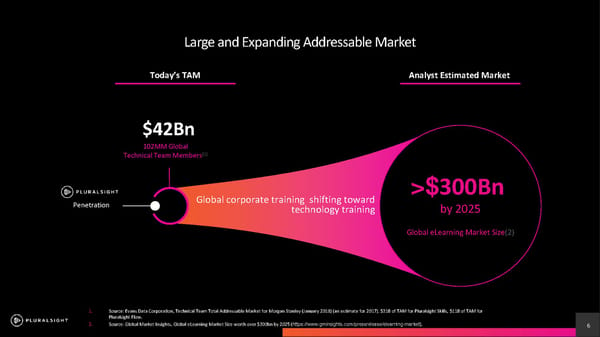
6 Large and Expanding Addressable Market 1. Source: Evans Data Corporation, Technical Team Total Addressable Market for Morgan Stanley (January 2018) (an estimate for 20 17) . $31B of TAM for Pluralsight Skills, $11B of TAM for Pluralsight Flow. 2. Source: Global Market Insights, Global eLearning Market Size worth over $300bn by 2025 ( https://www.gminsights.com/pressrelease/elearning - market ). Analyst Estimated Market >$ 300Bn by 2025 Global eLearning Market Size (2) Global corporate training shifting toward technology training $42Bn 102MM Global Technical Team Members (1) Todays TAM Penetration
7 Evolution of Pluralsight
8 As of March 31, 2018 Business Analytics See the skills that exist in the organization and measure progress Paths & Channels Align learning to key business objectives Role IQ Discover the skills gaps holding team members back and fill them fast Interactive Courses Practice with hands - on coding challenges and guided feedback Projects Apply learned skills to real - world scenarios Skill IQ Assess skills in under 10 minutes and 20 questions

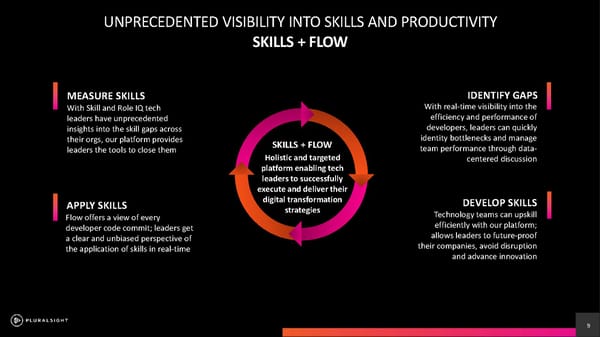
9 UNPRECEDENTED VISIBILITY INTO SKILLS AND PRODUCTIVITY SKILLS + FLOW MEASURE SKILLS IDENTIFY GAPS DEVELOP SKILLS APPLY SKILLS With Skill and Role IQ tech leaders have unprecedented insights into the skill gaps across their orgs, our platform provides leaders the tools to close them Technology teams can upskill efficiently with our platform; allows leaders to future - proof their companies, avoid disruption and advance innovation With real - time visibility into the efficiency and performance of developers, leaders can quickly identity bottlenecks and manage team performance through data - centered discussion Flow offers a view of every developer code commit; leaders get a clear and unbiased perspective of the application of skills in real - time Holistic and targeted platform enabling tech leaders to successfully execute and deliver their digital transformation strategies SKILLS + FLOW
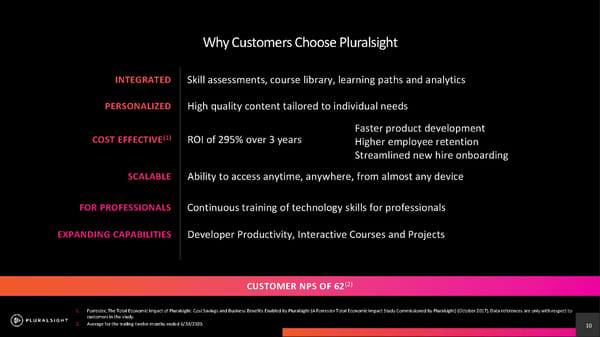
10 Why Customers Choose Pluralsight 1. Forrester, The Total Economic Impact of Pluralsight: Cost Savings and Business Benefits Enabled by Pluralsight (A Forrester T ota l Economic Impact Study Commissioned by Pluralsight) (October 2017). Data references are only with respect to customers in the study. 2. Average for the trailing twelve months ended 6/30/2020. Skill assessments, course library, learning paths and analytics INTEGRATED High quality content tailored to individual needs PERSONALIZED ROI of 295% over 3 years COST EFFECTIVE (1) Ability to access anytime, anywhere, from almost any device SCALABLE Continuous training of technology skills for professionals FOR PROFESSIONALS CUSTOMER NPS OF 62 (2) Faster product development Higher employee retention Streamlined new hire onboarding Developer Productivity, Interactive Courses and Projects EXPANDING CAPABILITIES
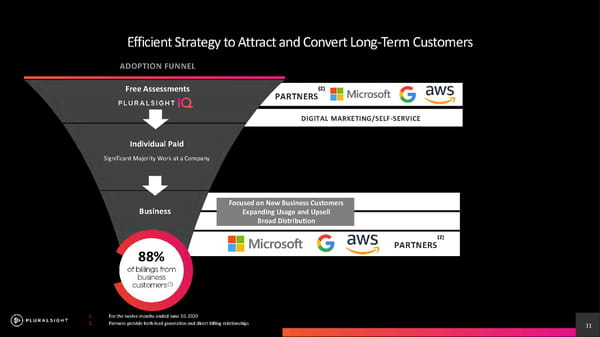
11 Efficient Strategy to Attract and Convert Long - Term Customers Free Assessments Individual Paid Significant Majority Work at a Company Business ADOPTION FUNNEL DIGITAL MARKETING/SELF - SERVICE Focused on New Business Customers Expanding Usage and Upsell Broad Distribution 1. For the twelve months ended June 30, 2020 2. Partners provide both lead generation and direct billing relationships 88% PARTNERS (2) PARTNERS (2)
12 Our Customers Represent All Industries Across the Globe 1. As of June 30, 2020 70% of the 2020 Fortune 500 (1) Users in over 180 countries (1) ~18,000 B2B Customers (1) Financial Services Internet Technology Healthcare / Pharma Media & Entertainment Consumer Goods / Retail Transportation & Logistics Government Contractors Manufacturing Energy Insurance Professional Services
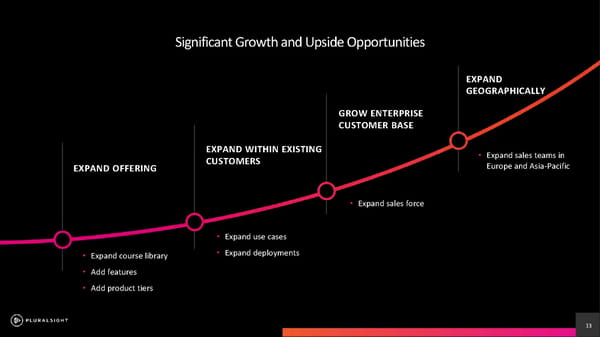
13 Significant Growth and Upside Opportunities Expand use cases Expand deployments Expand course library Add features Add product tiers Expand sales force Expand sales teams in Europe and Asia - Pacific EXPAND WITHIN EXISTING CUSTOMERS GROW ENTERPRISE CUSTOMER BASE EXPAND GEOGRAPHICALLY EXPAND OFFERING
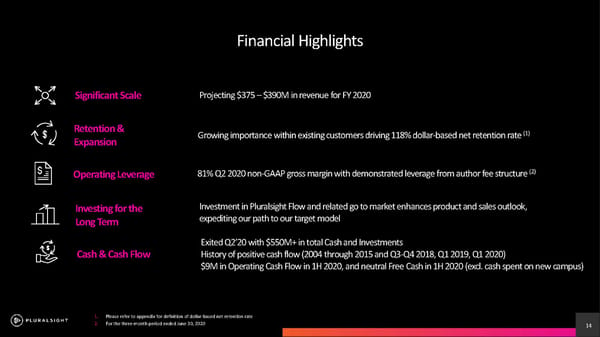
14 1. Please refer to appendix for definition of dollar - based net retention rate 2. For the three - month period ended June 30, 2020 Financial Highlights Projecting $375 $390M in revenue for FY 2020 Significant Scale Growing importance within existing customers driving 118% dollar - based net retention rate (1) Retention & Expansion 81% Q2 2020 non - GAAP gross margin with demonstrated leverage from author fee structure (2) Operating Leverage Investing for the Long Term Investment in Pluralsight Flow and related go to market enhances product and sales outlook, expediting our path to our target model Exited Q220 with $550M+ in total Cash and Investments History of positive cash flow (2004 through 2015 and Q3 - Q4 2018, Q1 2019, Q1 2020) $9M in Operating Cash Flow in 1H 2020, and neutral Free Cash in 1H 2020 (excl. cash spent on new campus) Cash & Cash Flow
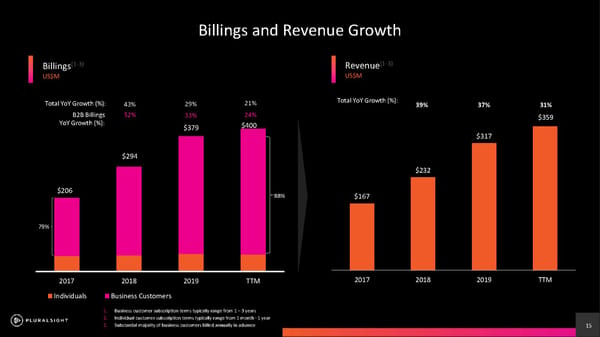
15 Billings (1 - 3) US$M Revenue (1 - 3) US$M 1. Business customer subscription terms typically range from 1 3 years 2. Individual customer subscription terms typically range from 1 month - 1 year 3. Substantial majority of business customers billed annually in advance $167 $232 $317 $359 2017 2018 2019 TTM 39% Total YoY Growth (%): 37% 31% Billings and Revenue Growth 2017 2018 2019 TTM Individuals Business Customers 79% 88% $206 $294 $379 43% 29% Total YoY Growth (%): B2B Billings YoY Growth (%): 52% 33% $400 21% 24 %
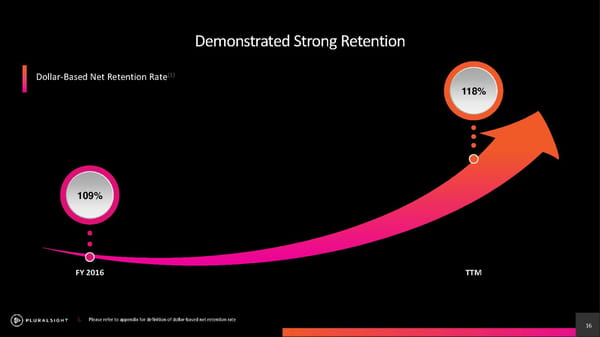
16 Demonstrated Strong Retention 1. Please refer to appendix for definition of dollar - based net retention rate FY 2016 109% Dollar - Based Net Retention Rate (1) 118% TTM
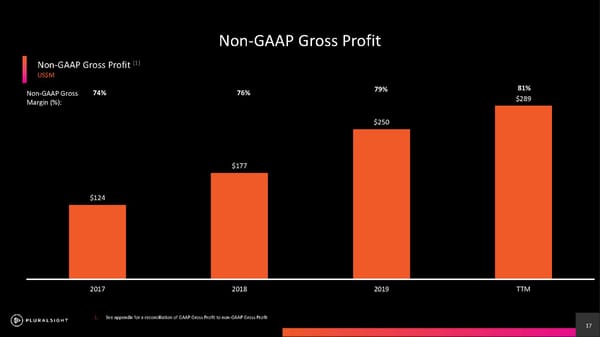
17 1. See appendix for a reconciliation of GAAP Gross Profit to non - GAAP Gross Profit Non - GAAP Gross Profit (1) US$M Non - GAAP Gross Profit $124 $177 $250 $289 2017 2018 2019 TTM 74% 76% Non - GAAP Gross Margin (%): 79% 81%
18 Increasing Volume of Large Deals B2B Accounts with > $100K, > $500K, and > $1M in Annual Billings 2017 2018 2019 Q2'20 $1M+ Customers $500K+ Customers $100K+ Customers 118% CAGR 80% CAGR 54% CAGR
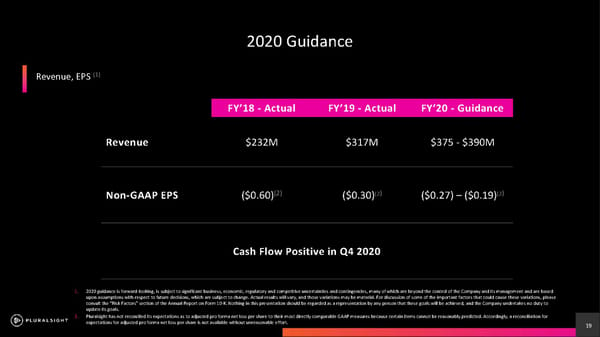
19 1. 2020 guidance is forward - looking, is subject to significant business, economic, regulatory and competitive uncertainties and con tingencies, many of which are beyond the control of the Company and its management and are based upon assumptions with respect to future decisions, which are subject to change. Actual results will vary, and those variation s m ay be material. For discussion of some of the important factors that could cause these variations, please consult the Risk Factors section of the Annual Report on Form 10 - K. Nothing in this presentation should be regarded as a repre sentation by any person that these goals will be achieved, and the Company undertakes no duty to update its goals. 2. Pluralsight has not reconciled its expectations as to adjusted pro forma net loss per share to their most directly comparable GA AP measures because certain items cannot be reasonably predicted. Accordingly, a reconciliation for expectations for adjusted pro forma net loss per share is not available without unreasonable effort. FY18 - Actual FY19 - Actual FY20 - Guidance Revenue $232M $317M $375 - $390M Non - GAAP EPS ($0.60) (2) ($0.30) (2 ) ($0.27) ($0.19) (2 ) Cash Flow Positive in Q4 2020 2020 Guidance Revenue, EPS (1)
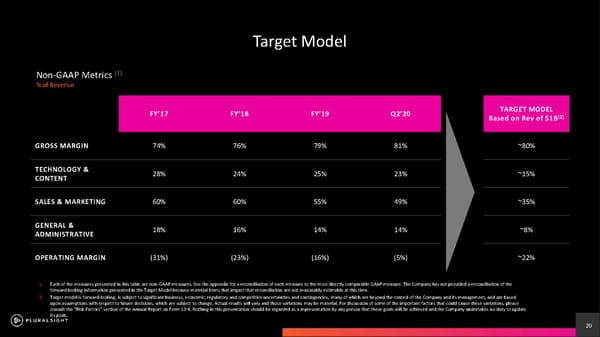
20 1. Each of the measures presented in this table are non - GAAP measures. See the appendix for a reconciliation of each measure to the most directly comparable GAAP measure. The Company has not provided a reconciliation of the forward - looking information presented in the Target Model because material items that impact that reconciliation are not reasona bly estimable at this time. 2. Target model is forward - looking, is subject to significant business, economic, regulatory and competitive uncertainties and cont ingencies, many of which are beyond the control of the Company and its management, and are based upon assumptions with respect to future decisions, which are subject to change. Actual results will vary and those variations ma y be material. For discussion of some of the important factors that could cause these variations, please consult the Risk Factors section of the Annual Report on Form 10 - K. Nothing in this presentation should be regarded as a repre sentation by any person that these goals will be achieved and the Company undertakes no duty to update its goals. FY17 FY18 FY19 Q220 TARGET MODEL Based on Rev of $1B (2) GROSS MARGIN 74% 76% 79% 81% ~80% TECHNOLOGY & CONTENT 28% 24% 25% 23% ~15% SALES & MARKETING 60% 60% 55% 49% ~35% GENERAL & ADMINISTRATIVE 18% 16% 14% 14% ~8% OPERATING MARGIN (31%) (23%) (16%) (5%) ~22% Target Model Non - GAAP Metrics (1) % of Revenue
21 Investment Highlights 1. TTM As of June 30, 2020. Please refer to appendix for definition of dollar - based net retention rate 2. For the three - month period ended March 31, 2020. See appendix for a reconciliation of GAAP Gross Profit to non - GAAP Gross Profit 3. Calculated by taking the number of global technical team members based on a study by Evans Data Corporation (2018) multiplied by our average billings per user as of December 31, 2018. $31B of TAM for Pluralsight Skills, $11B of TAM for Pluralsight Flow. 24% TTM YoY business billings growth with 88% billings from business customers (1) Sales & marketing investment supported by 118% retention rate (1) Addressing $42 billion market opportunity (3) History of positive cash flows and $550M+ of cash and investments Non - GAAP gross margin of 81% in Q2 2020 (2)
22 Appendix
23 GAAP to Non - GAAP Reconciliation $ Thousands 2020 Q2 2019 Q2 2018 Q2 2020 2019 TTM TTM TTM Q2 Q2 GAAP Gross Profit 283,279 207,981 136,359 75,048 58,059 Equity - Based Compensation 897 333 99 296 133 Employer Payroll Taxes on Employee Stock Transactions 39 32 - 15 13 Amortization of Acquired Intangibles 4,836 2,890 9,647 1,209 702 Non - GAAP Gross Profit 289,051 211,236 146,105 76,568 58,907 Non - GAAP Gross Profit Margin (%) 81% 77% 75% 81% 78% GAAP Operating Loss (156,394) (139,869) (125,668) (35,221) (37,381) Equity - Based Compensation 99,440 83,140 48,042 26,425 22,732 Employer Payroll Taxes on Employee Stock Transactions 3,030 3,953 - 997 1,329 Amortization of Acquired Intangibles 5,725 3,625 11,179 1,420 907 Secondary Offering Costs 1,260 918 - 1,260 - Acquisition Related Costs - 835 - - 835 Non - GAAP Operating Profit / (Loss) (46,939) (47,398) (66,447) (5,119) (11,578) Non - GAAP Operating Profit / (Loss) Margin (%) (13%) (17%) (34%) (5%) (15%)
24 GAAP to Non - GAAP Reconciliation (Contd) $ Thousands 2020 Q2 2019 Q2 2018 Q2 2020 2019 TTM TTM TTM Q2 Q2 GAAP Sales and Marketing Expense 233,042 181,302 133,958 57,759 50,046 Equity - Based Compensation 36,849 25,429 9,140 10,878 7,952 Employer Payroll Taxes on Employee Stock Transactions 973 1,559 - 329 533 Amortization of Acquired Intangibles 200 29 788 50 29 Non - GAAP Sales and Marketing Expense 195,020 154,285 124,030 46,502 41,532 Non - GAAP Sales and Marketing Expense as a % of Revenue 54% 56% 64% 49% 55% GAAP Technology and Content Expense 117,470 82,658 59,483 29,514 24,819 Equity - Based Compensation 25,803 15,933 5,928 6,884 5,137 Employer Payroll Taxes on Employee Stock Transactions 1,011 1,260 - 381 434 Amortization of Acquired Intangibles 689 706 707 161 176 Non - GAAP Technology and Content Expense 89,967 64,759 52,848 22,088 19,072 Non - GAAP Technology and Content Expense as a % of Revenue 25% 24% 27% 23% 25% GAAP General and Administrative Expense 89,161 83,890 68,586 22,996 20,575 Equity - Based Compensation 35,891 41,445 32,875 8,367 9,510 Employer Payroll Taxes on Employee Stock Transactions 1,007 1,102 - 272 349 Amortization of Acquired Intangibles - - 37 - - Secondary Offering Costs 1,260 918 - 1,260 - Acquisition Related Costs - 835 - - 835 Non - GAAP General and Administrative Expense 51,003 39,590 35,674 13,097 9,881 Non - GAAP General and Administrative Expense as a % of Revenue 14% 14% 18% 14% 13% Total Non - GAAP Operating Expense 335,990 258,634 212,552 81,687 70,485 Non - GAAP Operating Expense as a % of Revenue 94% 94% 110% 86% 93%
25 DEFINITION Dollar - based net retention rate To calculate our dollar - based net retention rate, we first calculate the subscription revenue in one quarter from a cohort of cu stomers that were customers at the beginning of the same quarter in the prior fiscal year, or cohort customers. We repeat this calculation for each quarter in the trailing four - quarter period. The numerator for dollar - based net r etention rate is the sum of subscription revenue from cohort customers for the four most recent quarters, or numerator period, and the denominator is the sum of subscription revenue from cohort customers for the four quar ter s preceding the numerator period. Dollar - based net retention rate is the quotient obtained by dividing the numerator by the denominator. GAAP to Non - GAAP Reconciliation (Contd) $ Thousands 2020 Q2 2019 Q2 2018 Q2 2020 2019 TTM TTM TTM Q2 Q2 Net cash provided by (used in) operating activities (1,036) 8,673 (24,406) (9,250) (7,184) Less: purchases of property and equipment (27,111) (8,812) (7,500) (6,626) (2,457) Less: purchases of content library (6,678) (4,277) (2,657) (2,113) (1,504) Free Cash Flow (34,825) (4,416) (34,563) (17,989) (11,145) Free Cash Flow Margin (%) (10%) (2%) (18%) (19%) (15%)