
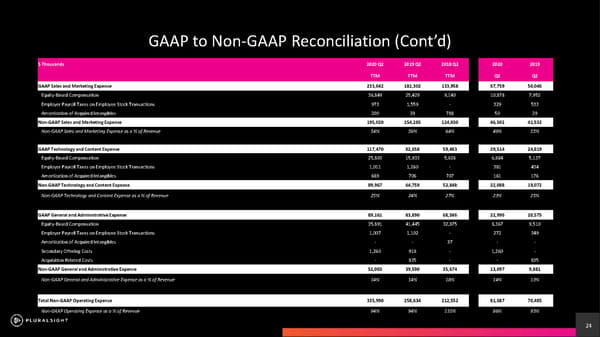
24 GAAP to Non - GAAP Reconciliation (Contd) $ Thousands 2020 Q2 2019 Q2 2018 Q2 2020 2019 TTM TTM TTM Q2 Q2 GAAP Sales and Marketing Expense 233,042 181,302 133,958 57,759 50,046 Equity - Based Compensation 36,849 25,429 9,140 10,878 7,952 Employer Payroll Taxes on Employee Stock Transactions 973 1,559 - 329 533 Amortization of Acquired Intangibles 200 29 788 50 29 Non - GAAP Sales and Marketing Expense 195,020 154,285 124,030 46,502 41,532 Non - GAAP Sales and Marketing Expense as a % of Revenue 54% 56% 64% 49% 55% GAAP Technology and Content Expense 117,470 82,658 59,483 29,514 24,819 Equity - Based Compensation 25,803 15,933 5,928 6,884 5,137 Employer Payroll Taxes on Employee Stock Transactions 1,011 1,260 - 381 434 Amortization of Acquired Intangibles 689 706 707 161 176 Non - GAAP Technology and Content Expense 89,967 64,759 52,848 22,088 19,072 Non - GAAP Technology and Content Expense as a % of Revenue 25% 24% 27% 23% 25% GAAP General and Administrative Expense 89,161 83,890 68,586 22,996 20,575 Equity - Based Compensation 35,891 41,445 32,875 8,367 9,510 Employer Payroll Taxes on Employee Stock Transactions 1,007 1,102 - 272 349 Amortization of Acquired Intangibles - - 37 - - Secondary Offering Costs 1,260 918 - 1,260 - Acquisition Related Costs - 835 - - 835 Non - GAAP General and Administrative Expense 51,003 39,590 35,674 13,097 9,881 Non - GAAP General and Administrative Expense as a % of Revenue 14% 14% 18% 14% 13% Total Non - GAAP Operating Expense 335,990 258,634 212,552 81,687 70,485 Non - GAAP Operating Expense as a % of Revenue 94% 94% 110% 86% 93%
 Pluralsight Investor Presentation Page 23 Page 25