
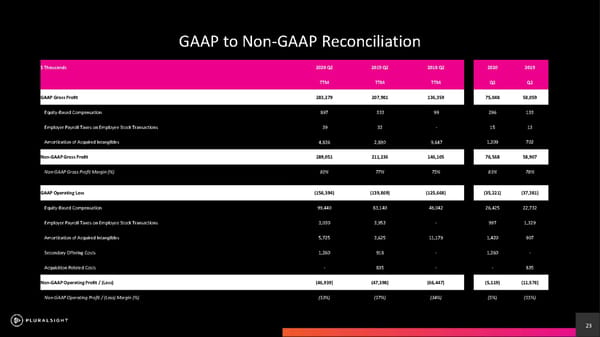
23 GAAP to Non - GAAP Reconciliation $ Thousands 2020 Q2 2019 Q2 2018 Q2 2020 2019 TTM TTM TTM Q2 Q2 GAAP Gross Profit 283,279 207,981 136,359 75,048 58,059 Equity - Based Compensation 897 333 99 296 133 Employer Payroll Taxes on Employee Stock Transactions 39 32 - 15 13 Amortization of Acquired Intangibles 4,836 2,890 9,647 1,209 702 Non - GAAP Gross Profit 289,051 211,236 146,105 76,568 58,907 Non - GAAP Gross Profit Margin (%) 81% 77% 75% 81% 78% GAAP Operating Loss (156,394) (139,869) (125,668) (35,221) (37,381) Equity - Based Compensation 99,440 83,140 48,042 26,425 22,732 Employer Payroll Taxes on Employee Stock Transactions 3,030 3,953 - 997 1,329 Amortization of Acquired Intangibles 5,725 3,625 11,179 1,420 907 Secondary Offering Costs 1,260 918 - 1,260 - Acquisition Related Costs - 835 - - 835 Non - GAAP Operating Profit / (Loss) (46,939) (47,398) (66,447) (5,119) (11,578) Non - GAAP Operating Profit / (Loss) Margin (%) (13%) (17%) (34%) (5%) (15%)
 Pluralsight Investor Presentation Page 22 Page 24